


Abstract
Liver biopsy is the gold standard for quantifying steatosis and fibrosis. It is unclear how noninvasive tests (NITs) accurately correlate to liver biopsy. The aim of this study was to characterize patients with metabolic-associated steatotic liver disease who underwent liver biopsy in South Texas and had at least 1 contemporaneous NIT result available to determine the accuracy of NITs as compared to liver biopsy in accurately staging fibrosis and steatosis. The study included 460 patients with liver biopsy and at least 1 NIT. Data captured was based on standard of care and was non-interventional in nature. Performance characteristics of the NITs were analyzed based on the degree of fibrosis defined by liver biopsy. The majority of patients were female (66.4%), middle-aged (51 years), and Hispanic/Latino (73.3%). In patients with F3/F4 fibrosis, FibroScan accurately identified only 45.9% with advanced fibrosis. Even when using society recommended results from fibrosis-4 combined with FibroScan, concordance with liver biopsy was only reported in 68.9% of patients. Patients with biopsy-defined advanced steatosis (S3) were identified as having advanced steatosis by FibroScan controlled attenuation parameter score in 89.7% of patients; however, controlled attenuation parameter score overly predicted advanced steatosis in 81.4% with biopsy-defined S1/S2 steatosis. NITs should be used as first line to assess steatosis and fibrosis; however, the optimal combination of these tests has not been elucidated and properly compared to liver biopsy to assess true diagnostic accuracy. Until the optimal set of NITs are found, any diagnostic or clinical inconsistencies should be resolved with liver biopsy to avoid staging errors, particularly underestimating fibrosis in those with advanced disease.
1. Introduction
Metabolic syndrome (MetS) refers to the group of conditions that contribute to an increased risk of cardiovascular and liver disease, including hypertension, diabetes, dyslipidemia, and obesity.[1]Nonalcoholic fatty liver disease (NAFLD) is the most common cause of chronic liver disease, affecting nearly 25% of the global population, and 50% to 60% in patients with MetS.[1,2] It encompasses a range of liver disorders closely linked to dysmetabolic conditions. Approximately 55.5% of patients with Type 2 diabetes mellitus have NAFLD.[3] Nonalcoholic steatohepatitis (NASH) is a subtype of NAFLD that includes inflammation, ballooning, and presence of Mallory hyaline on liver biopsy. NASH increases a patient’s risk of liver-related mortality and the stage of fibrosis is the main liver-related mortality predictor.[4] 15% of patients with Type 2 diabetes mellitus may have moderate-advanced fibrosis due to NASH.[5]
NAFLD and MetS are closely related. Insulin-induced hepatic lipogenesis results in metabolic dysfunction and insulin resistance is the core mechanism behind the progression of NAFLD to NASH, cirrhosis and hepatocellular carcinoma.[1,6] Given the interconnectedness of metabolic dysfunction and fatty liver disease, NAFLD was recently renamed to metabolic dysfunction associated steatotic liver disease (MASLD).[7] Similarly, NASH has been revised to metabolic dysfunction-associated steatohepatitis (MASH) although the transition of the use of NASH to MASH will take time to integrate. MASLD is characterized by hepatic steatosis identified on imaging or biopsy and presence of at least 1 of the 5 cardiometabolic risk factors, excluding other identifiable causes of hepatic steatosis. The cardiometabolic criteria for adults include being overweight/obese, hyperglycemia or usage of antidiabetic medications, high blood pressure (≥130/85 mm Hg) or usage of antihypertensive medications, and dyslipidemia (plasma triglycerides ≥ 1.70 mmol/L; plasma HDL-cholesterol ≤ 1.0 mmol/L) or usage of lipid-lowering agents. In the absence of evident cardiovascular risk factors, the term cryptogenic SLD is adopted. Additionally, if alcohol use disorder and MASLD co-exist, it is characterized as MetALD.[7]
Liver biopsy remains the gold standard for diagnosing and staging steatosis and fibrosis.[8] Liver biopsies are typically performed by either hepatology or interventional radiology. The METAVIR score is employed in the staging and monitoring of liver fibrosis and inflammation (F0 = no fibrosis; F1 = portal fibrosis without septa; F2 = portal fibrosis with few septa; F3 = numerous septa without cirrhosis; and F4 = cirrhosis).[9] Liver biopsy offers a direct examination of liver tissue, enabling precise evaluation of steatosis, inflammation, fibrosis, and associated liver damage – essential for risk stratification (F0 to F1 = low risk; F2 to F4 = high risk), severity assessment, and developing tailored treatment plans.[10]
Several patented and non-patented combined serum biomarker and clinical models have been developed to predict advanced fibrosis in MASLD. Many of these were developed using chronic hepatitis C patients and cutoff values were modified for MASLD-related advanced fibrosis. The NAFLD fibrosis score (NFS) and fibrosis-4 (FIB-4) score are the most widely validated of these nonproprietary tests and are easy to obtain for any provider. However, these tests are associated with “indeterminate” range scores in > 30% of patients.[11] Additionally, NFS and FIB-4 have reduced specificity in older patients and new thresholds for patients ≥65 years old have been proposed. These tests were developed in cohorts with a higher prevalence of advanced fibrosis and not as screening tools which is why they require sequential diagnostic tests with higher specificity for detecting advanced fibrosis in non-tertiary center populations.[12]
Imaging-based methods are employed in patients with a FIB-4 score > 1.3, and include ultrasound (US), magnetic resonance imaging, and computed tomography.[8] US provides an assessment of liver structure, particularly hepatic steatosis, and is an initial step in diagnosis. However, the absence of identifiable steatosis or fibrosis on US should not prompt clinicians to completely rule out MASLD.[13] Vibration controlled transient elastography or FibroScan, is a type of pulse-echo US measuring shear wave velocity to determine liver stiffness measurement and assess for significant hepatic fibrosis. Derived from the vibration controlled transient elastography, the controlled attenuation parameter (CAP) score is an assessment for hepatic steatosis; however, it does not accurately quantify or monitor changes in steatosis.[13]
The need for extensive screening for MASLD has led to the use of noninvasive tests (NITs), although their accuracy in staging fibrosis is still unknown. The purpose of this study is to characterize patients with MASLD who underwent liver biopsy in South Texas and had at least 1 contemporaneous NIT result available to determine the accuracy of NITs as compared to liver biopsy in accurately staging fibrosis.
2. Methods
This was a non-interventional, retrospective study in individuals seen at The Texas Liver Institute between 2017 and 2022 who had a liver biopsy and at least 1 NIT result. The study captured standard of care data and was approved by Advarra Institutional Review Board. The target patient population consisted of individuals either at risk of developing hepatic cirrhosis, MASLD, or MASH based on laboratory data and clinical history (Hx) or who were known to have one of these conditions and were undergoing active surveillance for disease progression. No patients were excluded from analysis based solely on other comorbidities. NIT tests considered for this study include FIB-4, NFS, and FibroScan. Patient data was independently verified by 2 reviewers for accuracy and completion. Patient demographics included age, gender, race, and ethnicity. Body mass index (BMI) was calculated. Laboratory data included aspartate aminotransferase (AST), alanine aminotransferase (ALT), gamma-glutamyl transpeptidase, alkaline phosphatase, albumin, creatinine, glomerular filtration rate, total bilirubin, platelets, transferrin saturation, ferritin, iron, and antinuclear antibodies.
The automated Biopince 16 gauge needle was used by hepatology and radiology to obtain liver biopsy tissue, preset to obtain up to 3.2 cm of tissue. Biopsy specimens on glass slides were assessed by pathologists experienced in interpreting liver biopsy specimens, using H and E and Masson Trichrome staining. The pathologists determined the NAFLD activity score (NAS) and fibrosis stage according to NASH Clinical Research Network criteria.[9] Liver biopsy data included the specialist who performed the biopsy (hepatology vs interventional radiology), length of the longest tissue biopsy sample, number of portal tracts, fibrosis score, presence of lobular inflammation, portal inflammation, steatosis, ballooning, and NAS per histology.
FibroScan was performed by technicians who underwent standardized training and met performance metrics per the manufacturer (Echosens). All patients were fasting prior to undergoing FibroScan. Data obtained from FibroScan reports included liver stiffness measurement, CAP, and interquartile range/median value. Published NIT cutoff values were used to define advanced fibrosis (FibroScan liver stiffness measurement > 12 kPa, FIB-4 ≥2.67, and NFS ≥0.671) and advanced steatosis (FibroScan CAP score > 290 dB/m).[13]
Patient demographics, baseline characteristics, labs, and biopsy were analyzed for the full dataset as well as by subgroups based on the liver biopsy defined degree of fibrosis (F0 vs F1/F2 vs F3/F4).
Positive predictive value, negative predictive value, sensitivity and specificity were analyzed based on the liver biopsy defined degree of fibrosis (F0–F2 vs F3/F4). The data were analyzed by an independent statistician using the R environment for statistical computing v4.3 (Vienna, Austria), and the significance level was a two-sided ɑ=0.05. Kruskal-Wallis test was used to assess the significance of the differences for the continuous variables (age and BMI). To compare categorical variables (e.g., gender, race) across subgroups, Chi-square test or Fisher exact test were used. Association between BMI and degree of steatosis was estimated with Spearman rank correlation test (ɑ=0.05).
Kruskal–Wallis rank sum test, Pearson Chi-squared test or Fisher exact test were used to calculate P-values. Wilcoxon rank sum test was used to compare tissue sample length versus specialist performing the biopsy and a Bonferroni correction was applied to the P-value to control for multiple comparisons.
3. Results
All 460 patients had liver biopsy results, 99.3% (447/460) had a FIB-4 score, 99.0% (455/460) had NFS, and 51.5% (237/460) had FibroScan results.
3.1. Patient characteristics
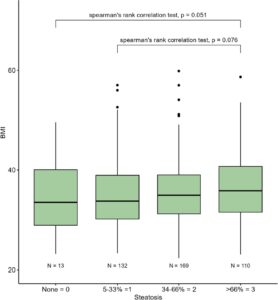
The median age was 51 (range 12–78) years old with higher degrees of fibrosis associated with older age. Two-thirds (66.4%) were female which was consistent across all degrees of fibrosis (P = .5). Only 23.6% of the population were non-Hispanic White with the vast majority being Hispanic/Latino/Mexican/Chicano White and this was consistent across all degrees of fibrosis (P = .8). Median BMI was 35 kg/m2 (range 20–66 kg/m2) and there was no association with degree of fibrosis (P = .2) (Table 1). Spearman rank correlation using a box plot revealed no association between BMI and biopsy defined degree of steatosis (Fig. 1).
Table 1 – Patient characteristics.
| Overall (N = 460) | F0 (N = 82) | F1/F2 (N = 241) | F3/F4 (N = 137) | P-value | |
|---|---|---|---|---|---|
| Age, years, median | 51 | 49 | 48 | 54 | <.001 |
| % Female | 66.4 | 62.2 | 68.8 | 65.0 | .5 |
| % Hispanic/Latino White | 73.3 | 76.7 | 69.2 | 79.5 | .8 |
| BMI, median | 35 | 33 | 35 | 34 | .2 |
| AST (U/L), median | 46 | 31 | 47 | 53 | <.001 |
| ALT (U/L), median | 66 | 54 | 75 | 64 | <.001 |
| AST/ALT | 0.70 | 0.62 | 0.65 | 0.83 | <.001 |
| GGT (U/L), median | 51 | 36 | 51 | 65 | .005 |
| ALP (U/L), median | 90 | 86 | 89 | 96 | .041 |
| Total bilirubin (mg/dL), median | 0.50 | 0.50 | 0.50 | 0.60 | .005 |
| Platelet count (103/uL), median | 246 | 247 | 257 | 222 | <.001 |
| Transferrin saturation median (%) | 24 | 24 | 24 | 24 | .6 |
| Ferritin (ng/mL), median | 160 | 111 | 163 | 168 | .070 |
| Iron (ug/dL), median | 83 | 82 | 83 | 88 | .2 |
| ANA positive (%) | 21.7 | 25.3 | 19.9 | 22.6 | .8 |
| History of Type 2 diabetes (%) | 54.2 | 30.5 | 53.8 | 69.3 | <.001 |
| History of dyslipidemia (%) | 59.4 | 48.8 | 61.5 | 62.2 | .094 |
| History of hypertension (%) | 60.7 | 57.3 | 55.6 | 71.5 | .008 |
| History of coronary artery disease (%) | 2.5 | 0 | 2.0 | 4.5 | .2 |
| History of HCC | 1.1 | 1.2 | 0.8 | 1.5 | .8 |
| FibroScan, LSM by TE, kPa median | 9.3 | 6.3 | 9.2 | 11.2 | <.001 |
| FibroScan, IQR/M median (%) | 12.0 | 11.0 | 12.0 | 13.0 | .4 |
| FibroScan, CAP, dB median | 330 | 323 | 336 | 330 | .063 |
| FIB-4 median | 1.19 | 0.88 | 0.99 | 1.72 | <.001 |
| NAFLD Fibrosis Score (NFS) median | −1.13 | −1.95 | −1.54 | −0.29 | <.001 |
ALP = alkaline phosphatase, ALT = alanine aminotransferase, ANA = antinuclear antibody, AST = aspartate aminotransferase, BMI = body mass index, CAP = controlled attenuation parameter, FIB-4 = fibrosis-4, GGT = gamma-glutamyltransferase, HCC = hepatocellular carcinoma, IQR/M = interquartile range/median, LSM = liver stiffness measurement, NAFLD = nonalcoholic fatty liver disease, NFS = NAFLD fibrosis score.
There were differences in AST (P < .001), ALT (P < .001), gamma-glutamyl transpeptidase (P = .005), alkaline phosphatase (P = .041), and total bilirubin (P = .005) across fibrosis stages with highest laboratory values in the F3/F4 group. AST/ALT ratio increased as the stage of fibrosis increased (P < .001). Platelet count decreased as the stage of fibrosis increased (P < .001). There was no association with albumin, creatinine, glomerular filtration rate, transferrin saturation, ferritin and iron levels or antinuclear antibody across the degrees of fibrosis. Patients in the F3/F4 subgroup had the highest proportion of diabetes (69.3%; P < .001) and/or hypertension (71.5%; P = .008). A Hx of dyslipidemia, coronary artery disease and/or hepatocellular carcinoma were not statistically different across fibrosis subgroups. FibroScan (P < .001), FIB-4 (P < .001), and NFS (P < .001) showed statistically significant associations to liver biopsy staging. CAP and interquartile range/median value did not correlate to the degree of fibrosis (P = .063) (Table 1).
A multivariate analysis utilizing liver biopsy NAS, race/ethnicity, gender, age, BMI, Hx of diabetes and Hx of dyslipidemia was performed to define predictors of advanced fibrosis (F3/F4). Only NAS (P < .001) and age (P = .042) were significant predictors of advanced fibrosis. The area under the receiver operating characteristic curve was 0.75.
A multivariable analysis utilizing the same variables to define predictors of advanced steatosis (S3). Only NAS (P < .001) was a significant predictor of advanced steatosis and the area under the receiver operating characteristic curve was 0.85.
3.2. Liver biopsy
Lobular inflammation (P < .001), portal inflammation (P = .021), steatosis (P < .001) and ballooning (P < .001) correlated with degree of fibrosis on liver biopsy. The NAS, which is the sum of steatosis + lobular inflammation + ballooning, correlated with degree of fibrosis on liver biopsy (P < .001).
The median biopsy sample length was 2.20 cm (0.60–3.70 cm) with 12 portal tracts (5.0–40.0) and was consistent across all degrees of fibrosis. With increasing length of tissue sample, there was a trend of more portal tracts present, though it was not statistically significant. Liver biopsy samples were statistically shorter in length when obtained by Interventional Radiology (1.6 cm; range 0.6–2.8 cm) versus Hepatology (2.2 cm; range 0.6–3.7 cm) (P < .001).
3.3. Accuracy of FibroScan, FIB-4, and NFS at predicting advanced fibrosis
FibroScan accurately identified 45.9% of patients with biopsy-defined F3/F4 as having advanced fibrosis (≥12 kPa) while categorizing the remaining 54.1% as not having advanced fibrosis. FIB-4 accurately identified 16.8% of patients with biopsy-defined F3/F4 as having advanced fibrosis (≥2.67) while categorizing the remaining 83.2% as not having advanced fibrosis. NFS accurately identified 23.4% of patients with biopsy-defined F3/F4 as having advanced fibrosis (≥0.671) while categorizing the remaining 76.6% as not having advanced fibrosis (Table 2).
Table 2 – Predicting advanced fibrosis. PPV, NPV, sensitivity and specificity for FibroScan, FIB-4 and NFS.
| F0–F2 | F3–F4 | PPV [95% CI] | NPV | Sensitivity [95% CI] | Specificity | Cutoffs used | |
|---|---|---|---|---|---|---|---|
| FibroScan | n = 163 | n = 74 | 0.459 [0.346, 0.573] | 0.754 | 0.459 [0.346, 0.573] | 0.755 | Liver biopsy F3/F4, FibroScan≥12 kPa |
| Low-int risk | 123 (75.5%) | 40 (54.1%) | |||||
| Advanced risk | 40 (24.5%) | 34 (45.9%) | |||||
| FIB-4 | n = 320 | n = 137 | 0.605 [0.450, 0.761] | 0.728 | 0.168 [0.105, 0.230] | 0.953 | Liver biopsy F3/F4, FIB-4 ≥2.67 |
| Low-int risk | 305 (95.3%) | 114 (83.2%) | |||||
| Advanced risk | 15 (4.7%) | 23 (16.8%) | |||||
| NAFLD Fibrosis Score (NFS) | n = 318 | n = 137 | 0.542 [0.415, 0.669] | 0.735 | 0.234 [0.163, 0.304] | 0.915 | Liver biopsy F3/F4, NFS≥0.671 |
| Low-int risk | 291 (91.5%) | 105 (76.6%) | |||||
| Advanced risk | 27 (8.5%) | 32 (23.4%) |
FibroScan CAP score accurately identified 89.7% of patients with biopsy-defined S3 as having advanced steatosis (>290 dB/m). However, FibroScan CAP score also identified 81.4% of patients with biopsy-defined S1/S2 steatosis as having advanced steatosis (>290 dB/m) (Table 3).
Table 3 – Steatosis. PPV, NPV, sensitivity and specificity for FibroScan CAP score.
| S0–S2 | S3 | PPV [95% CI] | NPV | Sensitivity [95% CI] | Specificity | Cutoffs used | |
|---|---|---|---|---|---|---|---|
| FibroScan CAP Score | n = 145 | n = 58 | 0.306 [0.237, 0.375] | 0.82 | 0.897 [0.818, 0.975] | 0.186 | Liver biopsy S3, FibroScan > 290 dB/m |
| Low-int risk | 27 (18.6%) | 6 (10.3%) | |||||
| Advanced risk | 118 (81.4%) | 52 (89.7%) |
Univariate and multivariate analyses were performed on the 74 biopsy defined F3/F4 patients with FibroScan results to identify predictors of FibroScan accuracy. The following variables were used for these analyses: AST, ALT, alkaline phosphatase, albumin, platelets, creatinine, gender, age, race, ethnicity, BMI, Hx of diabetes, Hx of dyslipidemia, and Hx of hypertension. In univariate analyses, only age (older age, P = .026), albumin (lower albumin, P = .012) were significant predictors of F3/F4 fibrosis; however, in multivariate analyses no variables were significant.
3.4. Use of FIB-4 and FibroScan to estimate degree of fibrosis
In our cohort, 236 patients had both FIB-4 and FibroScan. Twenty-six (26%) (61/236) of our patients had FIB-4 < 1.3 and FibroScan < 8 kPa results, which is the recommended cutoff combination used to rule out fibrosis per recent society guidance. When compared to liver biopsy, the NIT combination results were concordant with liver biopsy in 68.9% of patients. Unfortunately, 31.1% of patients who were categorized as having no fibrosis by NITs did indeed have F2–F4 fibrosis on biopsy. In patients with FIB-4 < 1.3, the number of patients identified as having no/mild fibrosis did decrease as the FibroScan kPa scores increased (Table 4).
Table 4 – Combining noninvasive test results to risk stratify continuity of care.
| FIB-4 | FibroScan | Total Patients | F0–F1 | F2 | F3–F4 |
|---|---|---|---|---|---|
| <1.3 | <8 kPa | 61 | 42 (68.9%) | 11 (18.0%) | 8 (13.1%) |
| <1.3 | 8–12 kPa | 47 | 26 (55.3%) | 8 (17.0%) | 13 (27.7%) |
| <1.3 | >12 kPa | 36 | 12 (33.3%) | 14 (38.9%) | 10 (27.8%) |
| <1.3 | Any | 144 | 80 (55.5%) | 33 (22.9%) | 31 (21.5%) |
| 1.3–2.67 | <8 kPa | 23 | 16 (69.6%) | 4 (17.4%) | 3 (13.0%) |
| 1.3–2.67 | 8–12 kPa | 27 | 9 (33.3%) | 4 (14.8%) | 14 (51.9%) |
| 1.3–2.67 | >12 kPa | 28 | 3 (10.7%) | 7 (25.0%) | 18 (64.3%) |
| 1.3–2.67 | Any | 78 | 28 (35.9%) | 15 (19.2%) | 35 (44.9%) |
| >2.67 | <8 kPa | 2 | 2 (100%) | 0 | 0 |
| >2.67 | 8–12 kPa | 4 | 1 (50%) | 1 (50%) | 2 (50%) |
| >2.67 | >12 kPa | 8 | 1 (12.5%) | 0 | 7 (87.5%) |
| >2.67 | Any | 14 | 4 (28.6%) | 1 (7.1%) | 9 (64.3%) |
On the other end of the spectrum, FIB-4 > 2.67 is correlated with advanced fibrosis/cirrhosis and patients with this score should have FibroScan performed to further define fibrosis stage. In our cohort, 87.5% of patients with FIB-4 > 2.67 and FibroScan > 12 kPa did have F3–F4 on biopsy. However, 4 (28.6%) patients with FIB-4 > 2.67 had F0–F1 on biopsy (Table 4).
FIB-4 between 1.3 and 2.67 and FibroScan between 8 and 12 kPa are considered indeterminate scores and require further assessment. In our cohort with FIB-4 scores between 1.3 and 2.67, there is a trend for lower fibrosis scores in those with FibroScan < 8 kPa (69.6%) and more advanced fibrosis/cirrhosis when FibroScan results were > 12 kPa (64.3%); however, there are more than one-third of patients where combined NIT data cannot be used to accurately predict fibrosis stage (Table 4).
4. Discussion
Screening for MASLD is recommended for patients with obesity and/or features of MetS, patients with prediabetes or type 2 diabetes mellitus, and patients with evidence of hepatic steatosis on imaging and/or persistently elevated plasma aminotransferase levels. Additionally, resmetirom was recently approved by the US Food and Drug Administration (FDA) for the treatment of noncirrhotic NASH with moderate to advanced liver fibrosis (consistent with stages F2 to F3 fibrosis). Per the US Food and Drug Administration approval prescribing information, liver biopsy is not required to diagnose or stage patients; however, the method used to stage patients is not defined and is left to the decision of the provider. Due to this lack of guidance, many providers will refer to society guidance documents for direction. Several societies have issued recommendations on how to stage patients with NASH.[13–15]
Based on recent society recommendations, a FIB-4 score should be the initial step in primary risk assessment. If the score is < 1.3, patients can be considered low risk (low prevalence population for advanced fibrosis) and should continue to be followed by primary care. FIB-4 is recommended every 1 to 2 years if type 2 diabetes/pretype 2 diabetes or ≥2 metabolic risk factors are present. In our dataset of patients with FIB-4 < 1.3, only 55.5% were biopsy proven F0–F1. Following the published guidance would leave the remaining patients, including 21.5% with biopsy proven F3–F4, with no further workup and in the care of primary care. Patients with FIB-4 < 1.3 comprised the largest group in our dataset (61.0%; 144/236).
The same guidance document recommends that all patients with FIB-4 > 2.67 be considered for referral directly to gastroenterology/hepatology care. Patients with FIB-4 > 2.67 comprised the smallest group in our dataset (5.9%; 14/236). Nearly two-thirds of the patients in this subset had biopsy proven F3–F4; however, the other one-third did not and could have remained with primary care with periodic risk assessment performed to track progression.
The guidance recommends that patients with an indeterminate (1.3–2.67) FIB-4 score should undergo further work up with transient elastography or enhanced liver fibrosis (ELF) score. ELF was not an approved test at the time our patient cohort was seen by our office so ELF scores were not available. Current recommendations state that use of vibration controlled transient elastography, which is utilized in FibroScan, is the best validated tool to identify advanced liver disease and predict liver-related outcomes. Patients with FIB-4 1.3 to 2.67 comprised 33.0% (78/236) of our population. Of those, 35.9% had biopsy proven F0 to F1, 19.2% had F2 and 44.9% had F3 to F4 so the lack of predictability does warrant secondary risk assessment. The group of patients deemed low risk per the algorithm (FibroScan < 8.0 kPa) comprised 29.5% (23/78) of the group and 69.6% of patients had biopsy defined F0 to F1. Unfortunately, the 30.4% of patients with biopsy proven F2 to F4 would remain with primary care per the algorithm. The guidance recommends that patients with intermediate risk (8–12 kPa) or high risk (>12 kPa) be referred to gastroenterology/hepatology care. In our patient cohort, 21.8% (12/55) patients with FIB-4 1.3 to 2.67 and FibroScan 8 kPa or higher had biopsy proven F0 to F1. This subset of patients is a low risk population and should remain with primary care based on biopsy results; however, the algorithm states that they should be referred to gastroenterology/hepatology care.
FibroScan CAP score is not a reliable NIT to predict steatosis in all patients. Most patients (83.7%; 170/203) in our cohort had FibroScan CAP scores > 290 dB/m which is defined as the cutoff for advanced steatosis. Liver biopsy is the most accurate way to define degree of steatosis and in our cohort 28.6% (58/203) had biopsy defined advanced steatosis. FibroScan accurately identified 89.7% of patients with biopsy defined S3 as having advanced steatosis (>290 dB/m). However, FibroScan CAP score also identified 81.4% of patients with biopsy defined S1/S2 steatosis as having advanced steatosis (>290 dB/m). Only 30.6% (52/170) of patients with CAP > 290 dB/m had biopsy defined S3 steatosis making FibroScan a poor marker for defining degree of steatosis, but appears adequate for qualitatively diagnosing steatosis. This finding is consistent with previous published reports. Magnetic resonance elastography/magnetic resonance imaging-estimated proton density fat fraction technology is being validated in clinical trials and appears promising; however, most clinicians do not have access and the cost of repeated studies will limit utility.
Liver biopsy remains the gold standard for fibrosis staging and quantifying degree of steatosis. However, sampling error can decrease diagnostic accuracy. Current recommendation for percutaneous liver biopsy is that a liver sample be obtained with a 16 gauge needle and measure at least 2 cm in length.[16] The number of portal tracts is related to the length of liver sample and > 11 portal tracts are required for adequate staging.[17] Percutaneous biopsy tends to obtain larger tissue specimens compared to transjugular approaches, which usually use 18 gauge needles. Small tissue samples can increase the risk for sampling errors as accurate biopsy interpretation relies on adequate tissue samples.
The optimal combination of these tests and newer ones has not been elucidated and properly compared to liver biopsy to assess true diagnostic accuracy. These tests must be assessable to clinics and cost-contained. Many of the newer, more accurate imaging NITs (e.g., magnetic resonance imaging-estimated proton density fat fraction) are not readily available outside of tertiary care centers. Similarly, some of the more accurate blood-based NITs (e.g., ELF) are expensive and not covered by insurance plans. Until the optimal set of assessable NITs is found, any diagnostic or clinical inconsistencies should be resolved with liver biopsy to avoid staging errors, particularly underestimating fibrosis in those with advanced disease.
Author contributions
Conceptualization: Lisa D. Pedicone, Fred Poordad.
Data curation: Keerthi Thallapureddy, David Twitchell, Kristen Ott, Chioma Owo, Nina Kumar, Nagasri Shankar, Anna Liles, Fatma Ozguc, Iqra Kazi, Harry Nguyen, Fred Poordad.
Formal analysis: Jonathan Gelfond, Martin Goros, Daisy Kwok.
Methodology: Lisa D. Pedicone, Fred Poordad.
Project administration: Keerthi Thallapureddy, Lisa D. Pedicone.
Resources: Eric Lawitz, Eugenia Tsai, Fabian Rodas, Carmen E. Landaverde.
Supervision: Lisa D. Pedicone, Fred Poordad.
Validation: Keerthi Thallapureddy, David Twitchell, Kristen Ott, Lisa D. Pedicone, Chioma Owo, Nina Kumar, Jonathan Gelfond, Nagasri Shankar, Martin Goros, Anna Liles, Fatma Ozguc, Iqra Kazi, Harry Nguyen, Carmen E. Landaverde, Fred Poordad.
Visualization: Keerthi Thallapureddy, Lisa D. Pedicone, Eric Lawitz, Eugenia Tsai, Fabian Rodas, Fred Poordad.
Writing – original draft: Keerthi Thallapureddy, Lisa D. Pedicone, Fred Poordad.
Writing – review & editing: Keerthi Thallapureddy, David Twitchell, Kristen Ott, Lisa D. Pedicone, Chioma Owo, Nina Kumar, Jonathan Gelfond, Nagasri Shankar, Martin Goros, Daisy Kwok, Anna Liles, Fatma Ozguc, Iqra Kazi, Harry Nguyen, Eric Lawitz, Eugenia Tsai, Fabian Rodas, Carmen E. Landaverde, Fred Poordad.
Abbreviations:
ALT alanine aminotransferase AST aspartate aminotransferase BMI body mass index CAP controlled attenuation parameter ELF enhanced liver fibrosis FIB-4 fibrosis-4 FibroScan also known as transient elastography Hx history LSM liver stiffness measurement MASLD metabolic dysfunction associated steatotic liver disease MetALD metabolic dysfunction and alcohol-related liver disease MetS metabolic syndrome NAFLD nonalcoholic fatty liver disease NAS NAFLD activity score NASH nonalcoholic steatohepatitis NFS NAFLD fibrosis score NIT noninvasive test US ultrasound
Reference: https://journals.lww.com/md-journal/fulltext/2025/04250/the_accuracy_of_fibroscan,_fib_4,_and_nonalcoholic.35.aspx